
Rent vs Buy Calculator
Enter the rent, the home and the rate (this week's 30-year average, 7.32%, to start) to follow both choices year by year, as what you'd have at the end of your stay, and see the year buying would pull ahead.
By Tess Mullins · Updated
Renting
Rent or buy
Renting comes out $89,225 ahead after 7 years
In the first year, owning costs $2,694 a month: $1,982 for the mortgage, plus property tax, homeowners insurance and maintenance. Renting costs $1,512 a month, renters insurance included.
| Year | Owner's equity | Renter's savings | Buying's lead |
|---|---|---|---|
| 1 | $62,051 | $103,441 | -$41,390 |
| 2 | $74,056 | $122,811 | -$48,755 |
| 3 | $86,521 | $142,879 | -$56,358 |
| 4 | $99,468 | $163,670 | -$64,202 |
| 5 | $112,922 | $185,215 | -$72,293 |
| 6 | $126,909 | $207,541 | -$80,632 |
| 7 | $141,457 | $230,682 | -$89,225 |
Buying takes $84,741 up front: a 20% down payment of $72,120 and $12,621 in closing costs. Renting keeps that money, earning 5.33% a year.
After 7 years, the home is worth $431,576. Selling it, less 6% in selling costs and the $264,224 still owed, leaves $141,457 in equity. The renter's savings, the up-front money plus each year's difference, have grown to $230,682.
Buying doesn't catch up within 7 years. A longer stay, a lower price or a bigger down payment moves the line. Rent rises 2.8% a year and the home's value 2.6% a year; no tax deduction is counted.
Not sure the rent is right for your income? The rent affordability calculator checks it, and the moving cost calculator adds the cost of the move either way.
General information, not financial advice: a projection from the rates you enter, which will change. It counts no tax deduction and no return on the home beyond its value. How we calculate
General information, not legal or financial advice.
The short answer
Buying wins when the equity you build outweighs what buying and selling cost, and that takes time: at the calculator’s defaults, 3.5% of the price goes to closing costs on the way in and 6% of the sale price on the way out. The lower the price next to the rent, the sooner buying pulls ahead. At a $360,600 home against $1,498 a month, the Census Bureau’s 2024 medians, with 7.32% on a 30-year loan and savings earning 5.33%, Renting comes out $89,225 ahead after 7 years.
That answer moves with every input. A lower price, a bigger down payment, a longer stay or a lower rate pulls it toward buying; a higher return on your savings or faster rent increases pull it the other way. Enter your own numbers.
How to use the calculator
- Enter the rent for a home like the one you’d buy, without utilities, and how fast it rises a year (2.8% is the national average over the year to September 2026).
- Enter the home: the price, your down payment and the mortgage rate. Under 20% down, mortgage insurance appears at Freddie Mac’s example rate; change it to your quote.
- Check the owning costs. Property tax and maintenance are shares of the home’s value; insurance, HOA fees, closing costs and selling costs are what they’d be where you’re looking.
- Set the market and your plans: the home’s value change a year, what your savings earn, and how many years you’d stay.
The result gives owning and renting a month in the first year, a year-by-year table of the owner’s equity against the renter’s savings, and the first year buying’s lead reaches zero. Use Copy link to keep a scenario and compare another.
Break-even by price-to-rent ratio
The home’s price divided by a year’s rent. At the calculator’s defaults, the year buying pulls ahead, and where it stands after 7 years:
| Price-to-rent ratio | Home price at $1,498 rent ($) | Buying ahead from year | Buying's lead after 7 years ($) |
|---|---|---|---|
| 10× | 179,760 | 4 | 29,277 |
| 15× | 269,640 | 18 | -29,620 |
| 20× | 359,520 | Not within 30 | -88,517 |
| 25× | 449,400 | Not within 30 | -147,414 |
| 30× | 539,280 | Not within 30 | -206,311 |
Year by year at the defaults
The median home against the median rent, 7 years:
| Year | Owner paid so far ($) | Renter paid so far ($) | Owner's equity ($) | Renter's savings ($) | Buying's lead ($) |
|---|---|---|---|---|---|
| 1 | 117,073 | 18,149 | 62,051 | 103,441 | -41,390 |
| 2 | 149,583 | 36,801 | 74,056 | 122,811 | -48,755 |
| 3 | 182,274 | 55,971 | 86,521 | 142,879 | -56,358 |
| 4 | 215,152 | 75,673 | 99,468 | 163,670 | -64,202 |
| 5 | 248,221 | 95,921 | 112,922 | 185,215 | -72,293 |
| 6 | 281,486 | 116,732 | 126,909 | 207,541 | -80,632 |
| 7 | 314,953 | 138,120 | 141,457 | 230,682 | -89,225 |
How we calculate
The two choices are compared as what you’d have at the end of your stay, not as rent against a mortgage payment.
- Up front. The buyer pays the down payment and closing costs. The renter keeps that money and invests it at the savings return.
- Each year, the owner pays the mortgage (a standard amortizing loan over 30 or 15 years), property tax and maintenance as shares of that year’s value, homeowners insurance, HOA fees and, under 20% down, mortgage insurance until the scheduled balance falls to 80% of the price.
- Each year, the renter pays the rent, rising by the yearly increase, and renters insurance.
- The difference is banked. Whichever choice costs less that year, the saving goes into the renter’s pot (or comes out of it), which earns the savings return. So the renter’s pot is the up-front money plus every year’s difference, with interest.
- At the end, the home is sold. Its value after the yearly change, less the selling costs and what is still owed on the loan, is the owner’s equity.
- Buying’s lead is the owner’s equity less the renter’s pot. The break-even year is the first with a lead of zero or more.
Returns and growth are compounded once a year, and the figures are before tax. No tax deduction is counted (below).
Where the defaults come from
- Mortgage rate: Freddie Mac’s Primary Mortgage Market Survey, the US weekly average for a 30-year fixed-rate loan as of October 22, 2026 (7.32%; the 15-year average was 6.68%).
- Rent increase: the Bureau of Labor Statistics’ Consumer Price Index, rent of primary residence, over the year to September 2026 (2.8%).
- Home value change: the Federal Housing Finance Agency’s House Price Index over the year to July 2026 (2.6%); its census divisions ranged from well under to well over that.
- Savings return: the 30-year Treasury yield on October 23, 2026 (5.33%), a return that can be locked in for as long as a mortgage runs, without stock-market risk. A stock fund can return more, with more risk; enter what you’d really do with the money.
- Price and rent: the Census Bureau’s American Community Survey 2024 medians: $360,600 for an owner-occupied home and $1,498 a month gross rent, as on the rent affordability calculator.
- Property tax: the same survey’s median real estate taxes paid, $3,211 a year, divided by the median value: 0.89% of value a year. Two separate medians, so an approximation; your county’s rate is better.
- Insurance: the National Association of Insurance Commissioners’ 2023 countrywide average premium, $1,737 a year for the common homeowners form (HO-3) and $173 for renters (HO-4), as on the renters insurance calculator.
- Mortgage insurance: Freddie Mac’s estimate of $30 to $70 a month for every $100,000 borrowed (0.36% to 0.84% of the loan a year); the default is the 0.51% its own example uses. It ends at 80% of the original value on request and at 78% automatically (CFPB).
- Closing and selling costs: Freddie Mac puts a buyer’s closing costs at 2% to 5% of the price and a seller’s commission at 3% to 8% plus fees and taxes of 2% to 4% of the sale price. The buying default takes the middle of its range; the selling default, 6%, sits near the low end of the combined span, where a negotiated commission lands.
- Maintenance: Fannie Mae’s rule of thumb of 1% to 4% of the home’s value a year, the low end for a newer home and the high end for one more than 30 years old.
What the calculator leaves out
- Tax deductions. Mortgage interest and property tax are deductible only if you itemize, and the standard deduction is $16,100 for a single filer and $32,200 for a couple in 2026. If you would itemize, buying does somewhat better than shown.
- Taxes on gains. The savings return and the home’s gain are both before tax. How each is taxed depends on your situation and can tilt the comparison either way.
- Inflation in insurance and HOA fees, which the calculator holds flat, and in utilities and the cost of a move, which it leaves out of both sides. The moving cost calculator covers the move.
- Rent control, a landlord’s renewal offer, or a security deposit, which change a renter’s numbers in ways no average captures.
- What a home gives beyond money: a place nobody can decline to renew, and the freedom to paint without a permission letter. Those are yours to weigh.
Worked examples
The first example uses the national figures the calculator starts with; the others change the price, rent, down payment and stay to show the math.
Example: The median US home against the median rent, staying 7 years
What we know
- Rent: $1,498 a month, rising 2.8% a year, plus $173 a year of renters insurance
- Home: $360,600 with 20% down at 7.32% over 30 years
- Owning: property tax 0.89% and maintenance 1% of the value a year, $1,737 of insurance; 3.5% to buy and 6% to sell
- Market: the home's value changes 2.6% a year; savings earn 5.33%
How it works out
- Buying takes $84,741 up front: a 20% down payment of $72,120 and $12,621 in closing costs. Renting keeps that money, earning 5.33% a year.
- In the first year, owning costs $2,694 a month: $1,982 for the mortgage, plus property tax, homeowners insurance and maintenance. Renting costs $1,512 a month, renters insurance included.
- After 7 years, the home is worth $431,576. Selling it, less 6% in selling costs and the $264,224 still owed, leaves $141,457 in equity. The renter's savings, the up-front money plus each year's difference, have grown to $230,682.
- Buying doesn't catch up within 7 years. A longer stay, a lower price or a bigger down payment moves the line.
Renting comes out $89,225 ahead after 7 years.
Example: A $250,000 home against $1,800 rent, staying 10 years
What we know
- Rent: $1,800 a month, rising 2.8% a year, plus $173 a year of renters insurance
- Home: $250,000 with 20% down at 7.32% over 30 years
- Owning: property tax 0.89% and maintenance 1% of the value a year, $1,737 of insurance; 3.5% to buy and 6% to sell
- Market: the home's value changes 2.6% a year; savings earn 5.33%
How it works out
- Buying takes $58,750 up front: a 20% down payment of $50,000 and $8,750 in closing costs. Renting keeps that money, earning 5.33% a year.
- In the first year, owning costs $1,912 a month: $1,374 for the mortgage, plus property tax, homeowners insurance and maintenance. Renting costs $1,814 a month, renters insurance included.
- After 10 years, the home is worth $323,157. Selling it, less 6% in selling costs and the $172,895 still owed, leaves $130,873 in equity. The renter's savings, the up-front money plus each year's difference, have grown to $86,780.
- Buying pulls ahead in year 5, once the equity built outweighs the up-front and selling costs.
Buying comes out $44,092 ahead after 10 years.
Example: The median home with 10% down, staying 3 years
What we know
- Rent: $1,498 a month, rising 2.8% a year, plus $173 a year of renters insurance
- Home: $360,600 with 10% down at 7.32% over 30 years
- Owning: property tax 0.89% and maintenance 1% of the value a year, $1,737 of insurance; 3.5% to buy and 6% to sell
- Market: the home's value changes 2.6% a year; savings earn 5.33%
How it works out
- Buying takes $48,681 up front: a 10% down payment of $36,060 and $12,621 in closing costs. Renting keeps that money, earning 5.33% a year.
- In the first year, owning costs $3,080 a month: $2,229 for the mortgage, plus property tax, homeowners insurance, maintenance and mortgage insurance. Renting costs $1,512 a month, renters insurance included.
- With less than 20% down, the loan carries mortgage insurance of $138 a month until the balance falls to 80% of the price: for 3 years.
- After 3 years, the home is worth $389,464. Selling it, less 6% in selling costs and the $314,523 still owed, leaves $51,574 in equity. The renter's savings, the up-front money plus each year's difference, have grown to $115,376.
- Buying doesn't catch up within 3 years. A longer stay, a lower price or a bigger down payment moves the line.
Renting comes out $63,802 ahead after 3 years.
Making the numbers work
- Start from a rent you can afford. The rent affordability calculator finds it from your pay; a lender checks the mortgage, tax and insurance against your income the same way.
- Count the move either way. A move costs money whether you rent the next place or buy it: the moving cost calculator compares a truck, movers and a container.
- Try the down payment both ways. A bigger down payment cuts the payment and the mortgage insurance but leaves less invested; a smaller one keeps more earning. Run both.
- Set the stay honestly. A job, a partner or a growing family can shorten it, and the selling costs land in full however short the stay was.
- Insure what you have now. Until you buy, the renters insurance calculator sizes the policy for your things.
Run the calculator twice: once with the rate and growth figures it starts with, and once with the home’s value flat and your savings earning nothing. If buying wins both times, the answer doesn’t depend on a forecast.
Frequently asked questions
Is it cheaper to rent or buy right now?
At the national figures the calculator starts with, a $360,600 home against $1,498 rent, 7.32% on a 30-year loan and savings earning 5.33%, Renting comes out $89,225 ahead after 7 years: owning costs $2,694 a month in the first year against $1,512 renting, and the renter's savings grow faster than the owner's equity. Your own rent, price and rate decide it, so enter them.
How long do you have to stay for buying to make sense?
Long enough for the equity built to outweigh the costs of buying and selling, about 3.5% of the price going in and 6% coming out at the defaults. The calculator names the first year buying's lead reaches zero, and the table on this page shows it by price-to-rent ratio at today's rate.
What is the price-to-rent ratio?
The home's price divided by a year's rent for a similar home. The lower it is, the sooner buying pulls ahead. The table on this page shows the break-even year for ratios of 10 to 30 at the calculator's defaults.
Does the calculator count the mortgage interest deduction?
No. Mortgage interest and property tax help only if you itemize, and only by the amount itemized deductions exceed the standard deduction, $16,100 for a single filer and $32,200 for a couple filing jointly in 2026. If you would itemize, buying does a little better than the calculator shows.
What is PMI and when does it end?
Private mortgage insurance, which a conventional loan carries when the down payment is under 20% of the price: about $30 to $70 a month for every $100,000 borrowed, by Freddie Mac's estimate. You can ask to cancel it once the balance is scheduled to reach 80% of the home's original value, and it ends on its own at 78%. The calculator charges it until the 80% point.
Where do the default numbers come from?
The mortgage rate is Freddie Mac's weekly average (October 22, 2026); the rent increase is the CPI's rent of primary residence over the year to September 2026; the home value change is the FHFA House Price Index over the year to July 2026; the savings return is the 30-year Treasury yield on October 23, 2026; the price, rent and property tax are Census Bureau medians; insurance is NAIC's average premium. Each one is an input, so use your own figures where you know them.
Next step
How Much Rent Can I Afford?Enter your pay before taxes and the utilities you'll pay to see the most rent that keeps housing within 30% of your income, what landlords' income rules allow, and how that compares with what renters in your state pay.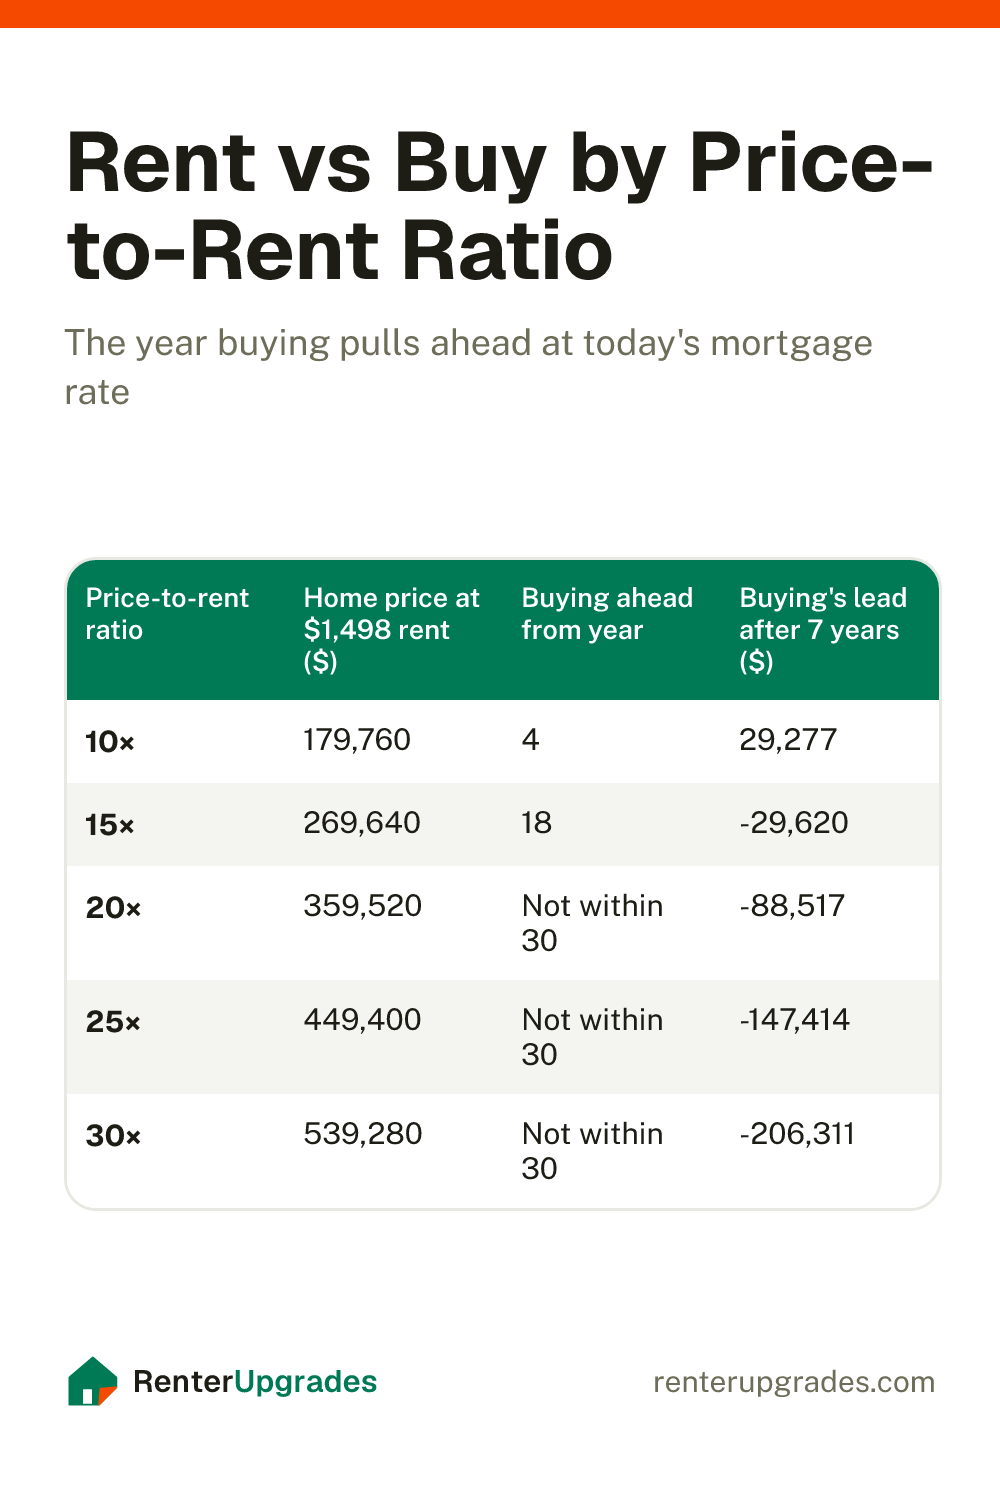
Save it for later
Pin this page so it's handy when you're ready to hang things.
Save to Pinterest (opens in a new tab)